Data Science · AI · Product

Madhumitha
Chandrasekaran

Glad you're here. Let's talk about what's worth building.

Data Science AI Automation Product Management
00 / 07
Scroll
About

Built to ask why,
driven to build what

I didn't start with data. I started with questions: why do systems fail the people they're built for? I found that data reveals the problem, AI scales the solution, and product is what makes it land. That's the triangle I work in. And I'm most alive when all three are firing at once.

Currently amazed by
Remember that thing you complained about and let go? Someone's raising a Series A on it. Next time, let's be that someone.
Happiest when
Something I built is being used by real people and making their lives a little easier.
Outside work
Table tennis (CBSE Nationals). Cafes. Environmental advocacy since I was ten.
01 / 07

Projects

01
AI-Driven Prognostic Monitoring and Personalized Intervention Platform for Alzheimer's
Developed a deep learning pipeline to classify MRI brain scans into four Alzheimer's disease stages, followed by LSTM-based time-series forecasting to predict disease progression and cognitive decline patterns. Built a clinician-facing application prototype that surfaced classification results, progression forecasts, patient history, and diagnostic insights through an interactive interface.
Academic
02
Moodify
Moodify is a real-time emotion-driven music recommendation system that uses facial expression recognition to detect the user's current mood and automatically generate a Spotify playlist tailored to it.
Academic
03
Autonomous Chess Piece Navigation System
Developed an AI-driven chess automation system that uses computer vision to detect board states, identify piece positions, and convert them into FEN notation for analysis by the Stockfish chess engine. The system computes optimal moves and translates them into physical board coordinates, enabling real-time robotic chess piece navigation.
Funded Research
04
QueryMind
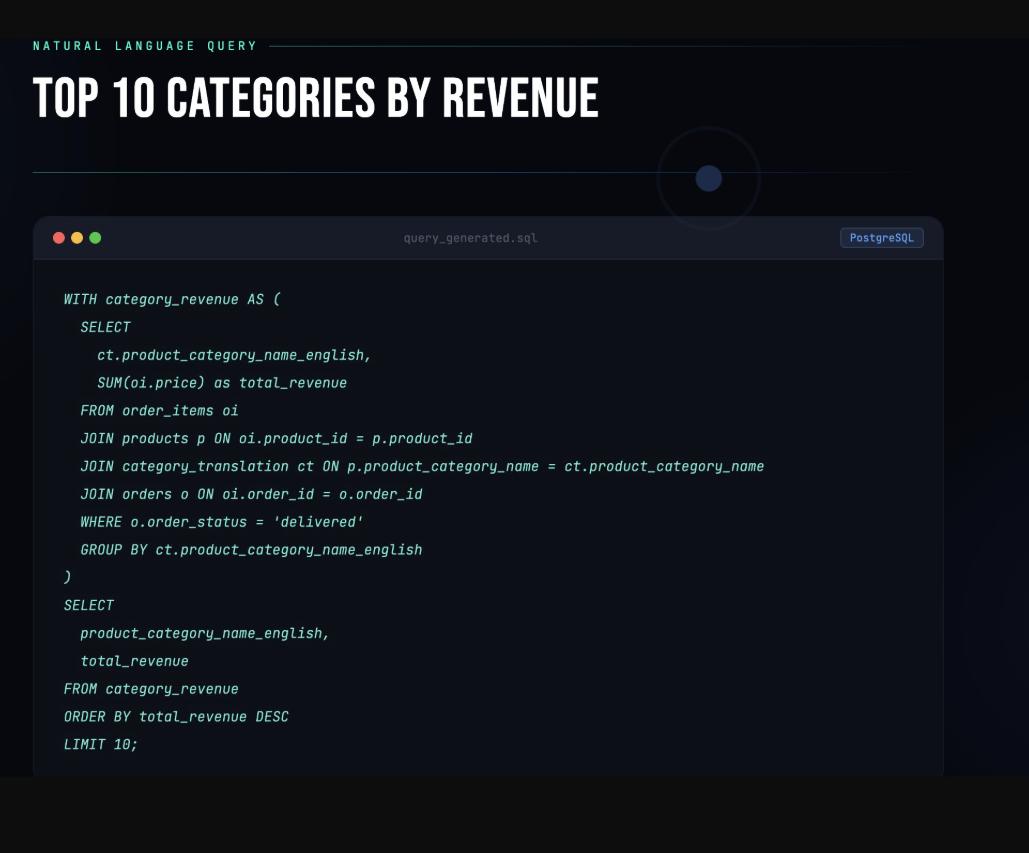
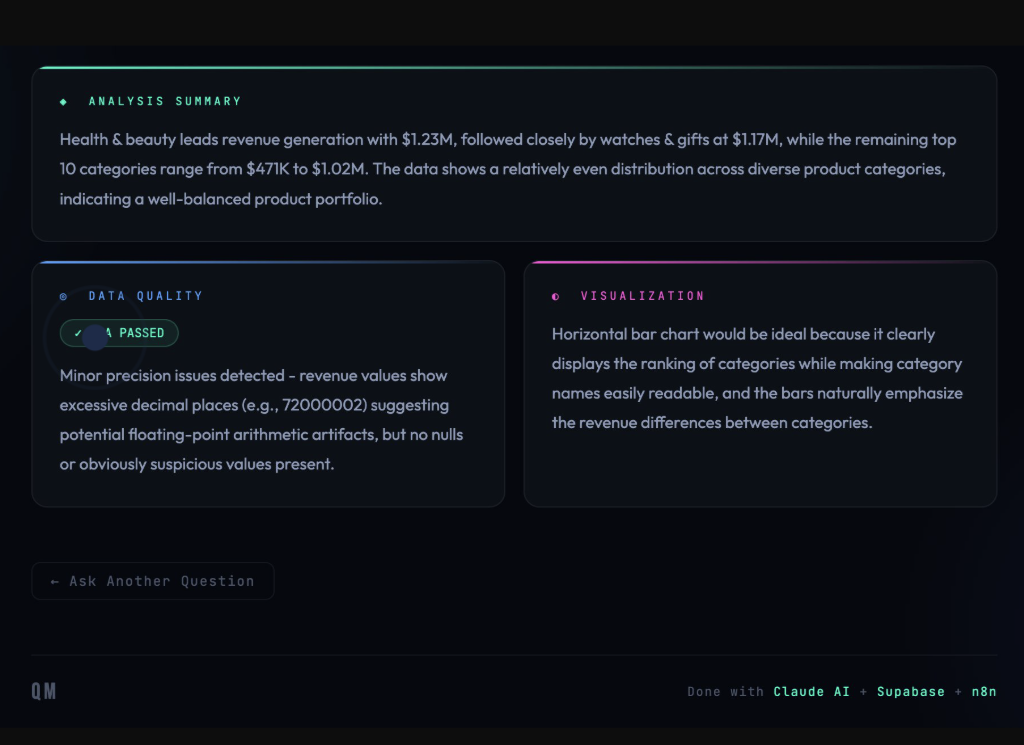
Built an AI-powered natural language analytics assistant that converts business questions into SQL queries, executes them on a live PostgreSQL database, and returns actionable insights through an automated workflow. Leveraged Claude AI for NL-to-SQL generation, n8n for orchestration, and Supabase for data access.
Personal
05
SubSight: AI-Powered Subscription Manager
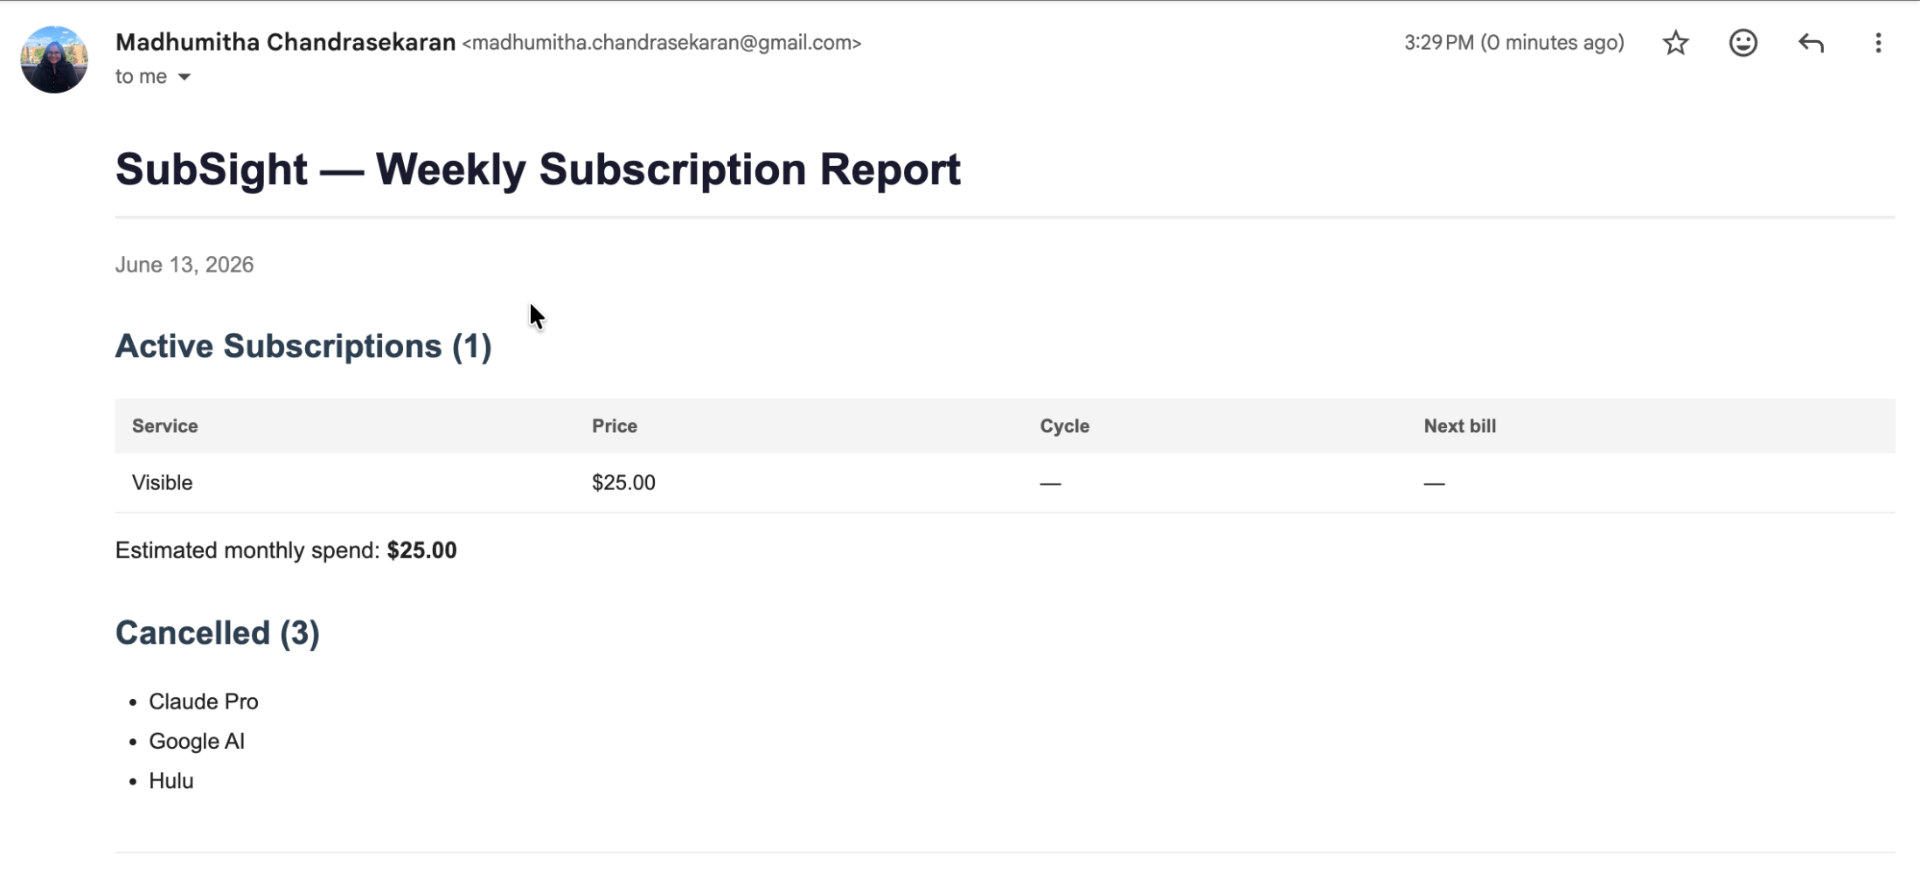
Built an AI-powered subscription management assistant that automatically scans billing emails, extracts subscription details using Claude AI, verifies service activity through web search, and delivers weekly spending reports. Detects trial expirations, price changes, and inactive services.
Personal
06
Multimodal Deception Detection: Audio Pipeline
Built a voice-only deception detector that extracts acoustic cues from short video clips, pitch, vocal tremor, pause patterns and spectral shifts, and trains four classifiers to distinguish truthful from deceptive speech.
Academic
07
Revenue Intelligence Platform: Finance Analytics
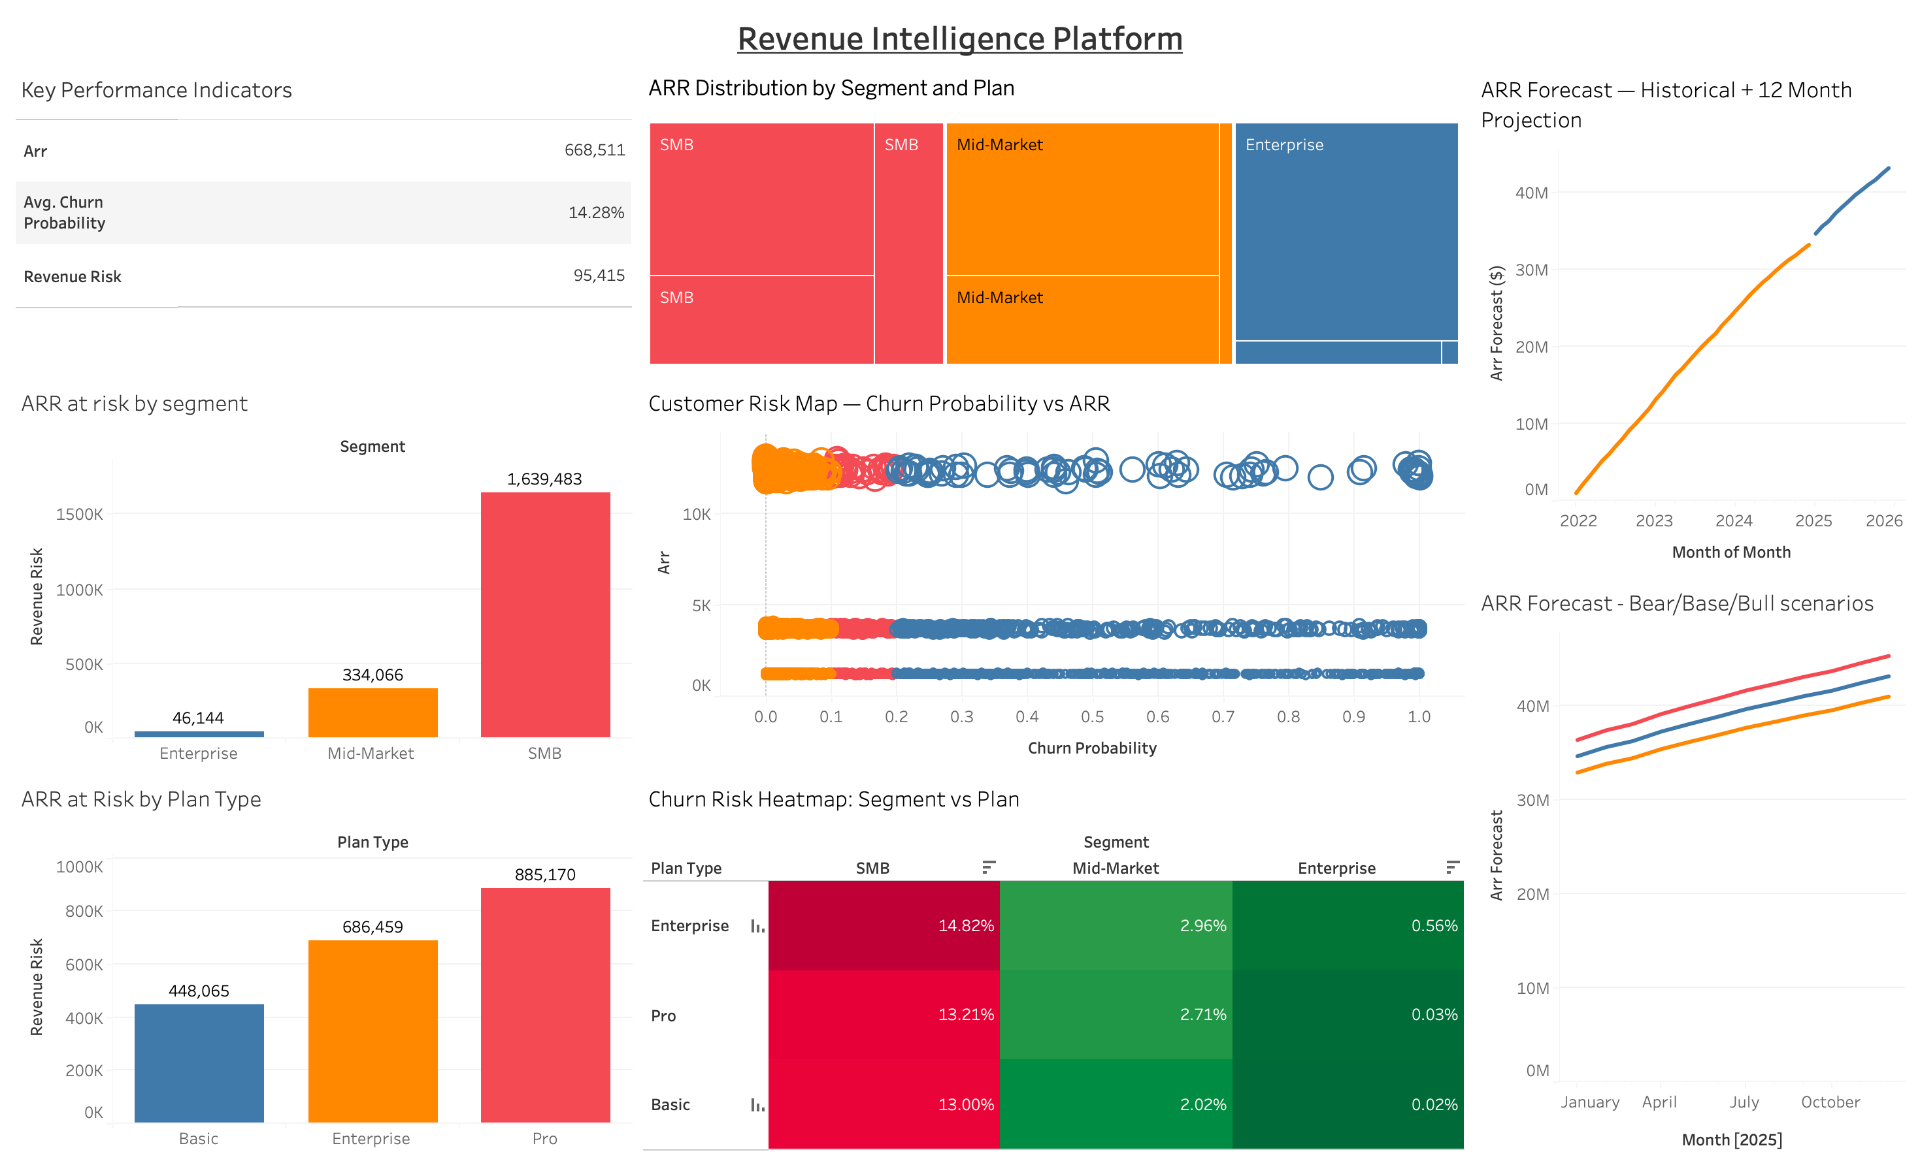
End-to-end finance analytics system that forecasts ARR, quantifies churn-driven revenue risk, and enables Bear/Base/Bull scenario planning. Built on a Databricks medallion lakehouse (Bronze / Silver / Gold) with PySpark and Delta Lake, an XGBoost churn model (AUC 0.986), Prophet forecasting (+30% projected ARR), and an interactive Tableau dashboard.
Personal
02 / 07
Expertise

Skills

Languages & Tools
PythonSQLpandasNumPyscikit-learnPyTorchTensorFlow / KerasMatplotlibSeabornPostgreSQLGitReplitJupyter
AI & Generative AI
Large Language ModelsRetrieval-Augmented GenerationPrompt EngineeringAI AgentsAgentic AI SystemsNLPAI Model EvaluationIntelligent AutomationConversational MemoryAPI IntegrationClaude AI APIChatGPT
Data Science & ML
Supervised LearningUnsupervised LearningA/B TestingExploratory Data AnalysisFeature EngineeringCross-ValidationHyperparameter TuningModel Evaluation (Precision / Recall / AUC-ROC)Hypothesis TestingRegression & Predictive ModelingTime-Series ForecastingDeep LearningComputer Vision
Analytics & Visualization
Power BITableauPlotlyStreamlitExcelPowerPointDashboard DevelopmentKPI ReportingData Quality & ValidationData ModelingData GovernanceETL Pipeline Design
Cloud & Data Engineering
GCPDatabricksREST APIsWorkflow Orchestration (n8n)SupabaseSQLitePower AutomateCopilot StudioGmail APIExa
Product & Strategy
Product DiscoveryUser ResearchRequirements DefinitionCompetitive AnalysisRoadmap PlanningStakeholder AlignmentAgile / ScrumExperimentation
Communication
Data-Driven StorytellingStakeholder PresentationsNon-Technical TrainingKnowledge Transfer
03 / 07
Background

Work Experience

Jun – Aug 2024
Pune, India
Technology Intern – Data & Business Transformation
Barclays · Pune, Maharashtra, India
Led finance workflow digitization for Private Banking, building SQL-backed automation and financial models that reduced reporting cycle time by 30% and accelerated monthly review processes.

Replaced legacy spreadsheet processes with automated ETL pipelines, improving data reliability and audit traceability across cross-functional finance and operations teams.

Optimized complex SQL queries against Oracle databases to extract and transform large financial datasets, powering ad-hoc and recurring strategic reports for senior leadership.

Validated model outputs against downstream reporting tools during handoff, performing integration checks to confirm data accuracy and format compatibility across systems.
SQLOracle DBETLFinancial ModellingAutomation
Oct – Nov 2023
Chennai, India
Data Analytics Intern
Chennai Metro Rail Limited · Chennai, Tamil Nadu, India
Delivered 8 recurring weekly operational reports across 10+ stations using Excel (PivotTables, VLOOKUP, SUMIFS), consolidating multi-station data under tight deadlines for management review.

Built Power BI dashboards tracking revenue trends, ticket sales and ridership patterns, adopted by management for monthly business review, capacity planning and KPI monitoring.

Identified peak-hour demand gaps and revenue fluctuations through EDA, directly informing route scheduling and capacity allocation decisions.
Power BIExcelEDAKPI ReportingData Visualization
04 / 07
Academic

Education

Aug 2025 – Aug 2026
Berkeley, CA
Master of Analytics
University of California, Berkeley
Fall 2025 Coursework
Python for Analytics Optimization Analytics Risk Modeling, Simulation & Data Analytics ML & Data Analytics Analysis & Design of Databases
Spring 2026 Coursework
Economics of Supply Chain Machine Learning & Data Analytics 2 Introduction to Data Modeling, Statistics & System Simulation Transportation Analytics
2021 – 2025
Chennai, India
B.Tech Information Technology
Sri Sivasubramaniya Nadar College of Engineering
Relevant Coursework
Programming & Design Patterns Database Technology Data Communication & Networks Automata Theory Probability & Statistics Data Analytics & Visualization Operating Systems Artificial Intelligence Internet of Things Web Programming Cloud & Distributed Computing Deep Learning Computer Vision Machine Learning Full Stack Development
Certifications
Postman API Fundamentals Student Expert
Postman · API Development
Introduction to Internet of Things
CISCO Networking Academy
Fuzzy Sets, Logic & Systems · 90%
NPTEL · IIT Coursework
Microsoft Power BI Data Analyst
Coursera · Microsoft · In Progress
Ongoing
05 / 07
Involvement

Leadership & Activities

200+
Students
Head of Content
SSN ACM-W Student Chapter

Led planning and creation of newsletters, event promotions and educational resources supporting workshops, hackathons and speaker sessions. Coordinated a team of student contributors and drove digital outreach that increased event participation and chapter visibility across the department.

40+
Trained
Technical Lead, IoT
IEEE Computer Society · SSN

Guided students through hands-on technical sessions on IoT architectures, sensor integration and embedded systems. Mentored junior members in building real-world IoT prototypes and introduced applied problem-solving through connected device development.

₹4L
Budget
USG Finance & GA PR/Sponsorship
SSN–SNUC Model United Nations

Managed financial planning and execution of a ₹4 lakh conference budget for a 3-day international conference with 300+ delegates and 20+ judges. Led cross-functional resource allocation and external sponsorship outreach to ensure a high-quality experience for all participants.

150+
Engaged
Event Coordinator
Association of Information Technologists '24 · SSN

Organised technical and community events to foster collaboration and knowledge-sharing in the IT department. Managed logistics, participant registrations and cross-team coordination, engaging 150+ students across departmental events and strengthening the technical community.

1000+
Attendees
Department Coordinator
Instincts '25 · SSN Annual Cultural Fest

Served as liaison between the IT department and the central organising committee for SSN's annual cultural festival. Coordinated volunteers, managed departmental participation across events and ensured smooth communication throughout a festival bringing together thousands of students across departments and institutions.

Per Year
Student Editor
Identity · SSN IT Dept Bi-Annual Newsletter

Led curation and editing of bi-annual issues documenting student achievements, technical developments and departmental activities. Collaborated with faculty and student contributors to produce well-structured issues reaching hundreds of students, faculty members and alumni.

06 / 07
Get in touch

Let's build
something
together

madhumitha.chandrasekaran@gmail.com

Location
Berkeley, CA · Open to relocation
Looking for
Data · AI · Product roles
Available from
June 2026
07 / 07
01 Academic Project

AI-Driven Prognostic Monitoring and Personalized Intervention Platform for Alzheimer's

End-to-end deep learning pipeline for staging Alzheimer's disease and forecasting cognitive decline.

Role
Team member · time-series analysis, LSTM modeling & clinician app · 2024–2025
Stack
Python · PyTorch · TensorFlow / Keras · LSTM · CNNs · Flutter · Git
Overview

Developed a deep learning pipeline to classify MRI brain scans into four Alzheimer's disease stages, followed by LSTM-based time-series forecasting to predict disease progression and cognitive decline patterns. Built a clinician-facing application prototype that surfaced classification results, progression forecasts, patient history, and diagnostic insights through an interactive interface.

Highlights
  • Four-class MRI classification (Non-Demented, Very Mild, Mild, Moderate Dementia) using a CNN-LSTM hybrid achieving 87% accuracy.
  • Correlated CNN-extracted features with longitudinal OASIS dataset data to model disease evolution over multiple time points.
  • Prepared MRI feature vectors into patient-level time-series sequences capturing temporal patterns including cortical thinning and ventricular dilation.
  • Implemented LSTM networks to learn long-term sequential dependencies and avoid vanishing gradient problems.
  • Correlated MRI features with cognitive scores (MMSE, ACE) and clinical ratings to build prediction patterns between brain atrophy and cognitive impairment stages.
  • Built a forecasting model to predict future atrophy patterns and cognitive decline trajectories, supporting early intervention and personalized treatment planning.
  • Developed the clinician-facing app: MRI upload and auto-classification (AD / CN / EMCI / LMCI), patient history tracking and confidence scores.
  • Enabled side-by-side comparison of MRI-based classification with longitudinal assessments for comprehensive diagnosis support.
  • Published in IEEE Xplore at the 2025 ICCDS.
Problem

Clinicians lack integrated tooling that links MRI-based staging with longitudinal cognitive forecasts. Existing models stop at classification and leave progression and intervention planning to manual interpretation.

My Role

Part of a research team. My contributions focused on time-series analysis, LSTM modeling and building the clinician-facing application interface. I correlated CNN-extracted features with the longitudinal OASIS dataset, prepared MRI feature vectors into patient-level time-series sequences, and implemented LSTM networks to learn long-term sequential dependencies. I also correlated MRI features with cognitive scores (MMSE, ACE) and clinical ratings to build prediction patterns, and developed the forecasting model to predict future atrophy and cognitive decline trajectories.

What it Does

Classifies MRI scans into 4 Alzheimer's progression stages using a CNN-LSTM hybrid. Captures spatial patterns (CNN) and longitudinal progression signals across slices (LSTM). Performs image preprocessing and augmentation: normalization, resizing, dataset balancing. Provides a visual analytics interface for clinicians highlighting affected brain regions. Achieved 87% classification accuracy across dementia progression stages.

Clinician App

I developed the clinician-facing application with MRI upload and auto-classification (AD / CN / EMCI / LMCI), patient history tracking and confidence scores. It enables side-by-side comparison of MRI-based classification with longitudinal assessments for comprehensive diagnosis support.

Outcome

Delivered a working prototype and an IEEE publication validating the pipeline. The interface lets clinicians move from a single scan to a personalized progression view in one workflow.

Visuals


Certification of Paper Presentation
Certificate of Participation – ICCDS 2025
02 Academic Project

Moodify

Real-time facial emotion recognition that generates personalized Spotify playlists.

Role
Team member · emotion detection & classification pipeline · 2023–2024
Stack
Python · CNN · OpenCV / Haar Cascade · PCA · K-Means · Spotify API · Flask
Overview

Moodify is a real-time emotion-driven music recommendation system that uses facial expression recognition to detect the user's current mood and automatically generate a Spotify playlist tailored to it.

Highlights
  • Integrated the Haar Cascade Classifier to detect faces from live webcam video frames in real time.
  • Built a CNN-based emotion classification model trained on FER2013 (35,887 grayscale images) to classify 7 emotions: Angry, Disgust, Fear, Happy, Neutral, Sad and Surprise.
  • Implemented frame-level emotion tracking across 50 frames to determine the dominant emotion per session.
  • Handled image normalization, grayscale conversion and dimensional formatting for model inference.
  • Ensured the detected emotion label was correctly saved and passed downstream to the playlist mapping pipeline.
  • PCA reduced Spotify audio feature vectors to 6 components for efficient clustering.
  • K-Means grouped Spotify tracks into 7 mood-based clusters using audio features.
  • Detected emotion mapped to a mood cluster and a 26-song playlist was auto-created via the Spotify API.
My Role

Part of a team. My contribution focused on the emotion detection and classification model pipeline. I integrated the Haar Cascade Classifier to detect faces from live webcam video frames in real time, built the CNN-based emotion classification model trained on FER2013 (35,887 grayscale images) to classify 7 emotions, implemented frame-level emotion tracking across 50 frames to determine the dominant emotion per session, handled image normalization and grayscale conversion for model inference, and ensured the detected emotion label was correctly saved and passed downstream to the playlist mapping pipeline.

Pipeline

1) Haar Cascade Classifier detects faces from live webcam frames. 2) CNN classifies emotion into 7 states with a confidence score. 3) PCA reduces audio feature vectors to 6 components for efficient clustering. 4) K-Means groups Spotify tracks into 7 mood-based clusters using audio features. 5) Detected emotion maps to mood cluster and a 26-song playlist is auto-created via Spotify API.

Emotion to Playlist Mapping

Happy → Upbeat. Sad → Calming. Angry → High-energy. Disgust → Soothing. Surprise → Dynamic. Fear → Ambient. Neutral → Balanced.

Outcome

Delivered an end-to-end application integrating real-time emotion recognition, music recommendation, and Spotify playlist generation. The system tracks emotion across frames, maps the dominant mood to a curated playlist, and creates it automatically, giving users music that matches how they feel.

Visuals

03 Funded Research

Autonomous Chess Piece Navigation System

AI-driven chess system capable of detecting board states, computing optimal moves and executing them physically via a robotic arm in real time.

Role
Team project · SSN funded · 2023–2024
Stack
Python · OpenCV · Stockfish · Robotics control
Overview

AI-driven chess system capable of detecting board states, computing optimal moves and executing them physically via a robotic arm in real time. Funded by SSN Research Centre.

My Role
  • Built the computer vision pipeline that translates the physical board state into a digital representation using OpenCV: chessboard grid detection, square segmentation and piece recognition in real time.
  • Converted detected board configurations into FEN notation for integration with the Stockfish chess engine to compute optimal moves.
  • Contributed to designing the pipeline that maps AI-generated moves to board coordinates, enabling the system to translate strategic decisions into physical piece navigation.
  • Demonstrated how computer vision, AI decision systems and physical game environments can be integrated to create interactive intelligent systems.
What it Does
  • OpenCV detects chessboard grid, identifies piece positions and converts board state to FEN notation.
  • Stockfish engine computes optimal moves from the detected board configuration.
  • State-to-action pipeline maps digital moves to physical board coordinates for robotic navigation.
  • Real-time board recognition updates game states dynamically as moves are played.
  • Demonstrates full integration of computer vision, AI decision systems and physical automation.
Visuals

04 Personal Project

QueryMind: AI-Powered Natural Language Data Assistant

End-to-end AI analytics tool that converts plain English business questions into live SQL queries and actionable insights.

Role
Solo · end-to-end design, build & evaluation · 2025
Stack
Claude AI · n8n · Supabase · PostgreSQL · Python · REST APIs · Prompt Engineering · A/B Testing
Overview

An end-to-end AI-powered analytics tool that converts plain English business questions into live SQL queries and actionable insights. Built out of a personal interest in applying emerging AI technologies to real-world data workflows.

What it Does
  • Accepts a natural language business question via a branded dashboard.
  • Claude AI API generates optimized PostgreSQL from the question automatically.
  • Query executes live against Supabase PostgreSQL (Olist dataset, 100K+ orders, 9 relational tables).
  • Returns structured analysis: plain-English summary, data quality audit and visualization recommendation.
  • n8n orchestrates the full workflow end-to-end with no manual intervention.
A/B Prompt Engineering Study

Conducted a rigorous A/B test comparing a minimal system prompt against a schema-aware engineered prompt across 20 diverse business questions, measuring SQL accuracy, query correctness and output reliability. The engineered prompt achieved significantly higher accuracy, providing evidence-based justification for the final system design.

Key Outcomes
  • End-to-end NL-to-SQL pipeline with live database execution and structured output.
  • Schema-aware prompt engineering validated through experimental A/B design.
  • Demonstrates proficiency in AI tool integration, automated pipeline development and translating technical outputs into business-ready insights.
  • Custom-built branded dashboard for non-technical business users.
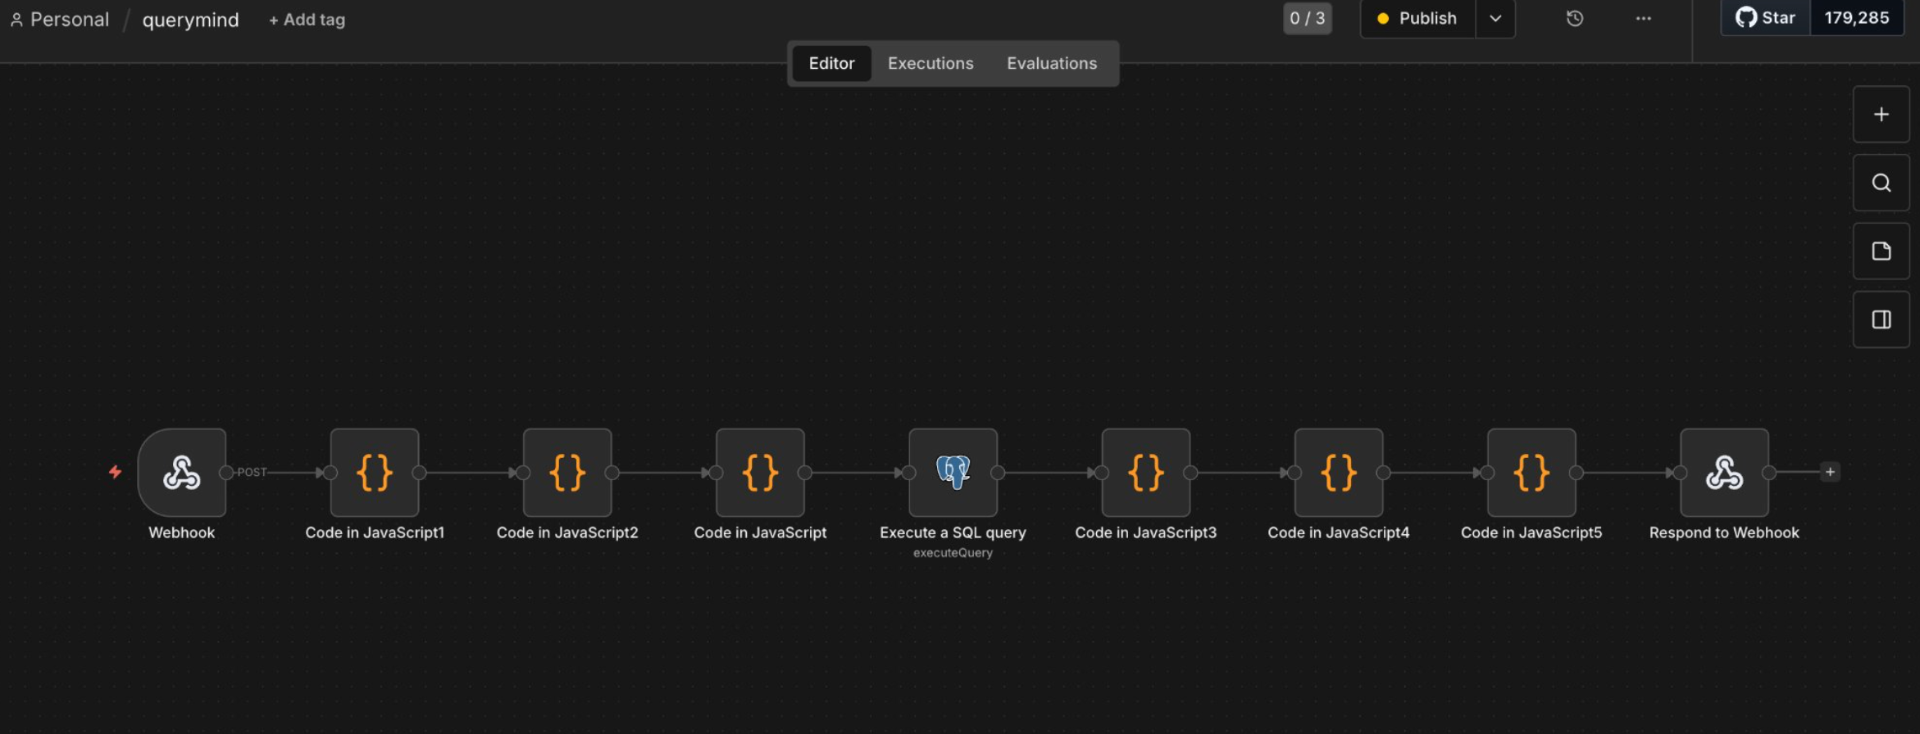
Visuals
QueryMind n8n workflow
QueryMind generated SQL query QueryMind analysis summary

05 Personal Project

SubSight: AI-Powered Subscription Manager

A personal automation product that scans your Gmail for subscription emails, extracts billing data using Claude AI, and delivers a clean weekly report every Sunday.

Role
Solo · end-to-end design, build & automation · 2025
Stack
Python · FastAPI · Claude AI · Gmail API · Exa Search · SQLite · APScheduler
Overview

Built to answer one question: what am I actually paying for, and is it still worth it? SubSight scans Gmail for subscription, billing and trial emails, uses Claude AI to extract structured billing data, verifies service status via Exa web search, and delivers a formatted weekly report autonomously, with no manual intervention required.

What it Does
  • Scans Gmail for subscription, billing, receipt and trial emails from the last 30 days.
  • Uses Claude AI to extract service name, price, billing cycle and trial dates from raw email content.
  • Detects price changes between billing cycles and alerts you once in the next report.
  • Flags free trials ending within 7 days before your card gets charged.
  • Verifies via Exa web search whether active services are still operating.
  • Sends a formatted weekly report every Sunday at 8am with active spend, alerts and cancelled services.
  • Runs autonomously via a macOS LaunchAgent, no terminal required after setup.
Key Outcomes
  • End-to-end automated pipeline: Gmail → Claude extraction → Exa verification → weekly email digest.
  • Handles edge cases: re-subscriptions after cancellation, price change deduplication, trial expiry warnings.
  • REST API (FastAPI) with trigger endpoints for on-demand scan, verify, report and full pipeline runs.
  • Demonstrates real-world application of LLM extraction, workflow automation and API orchestration.
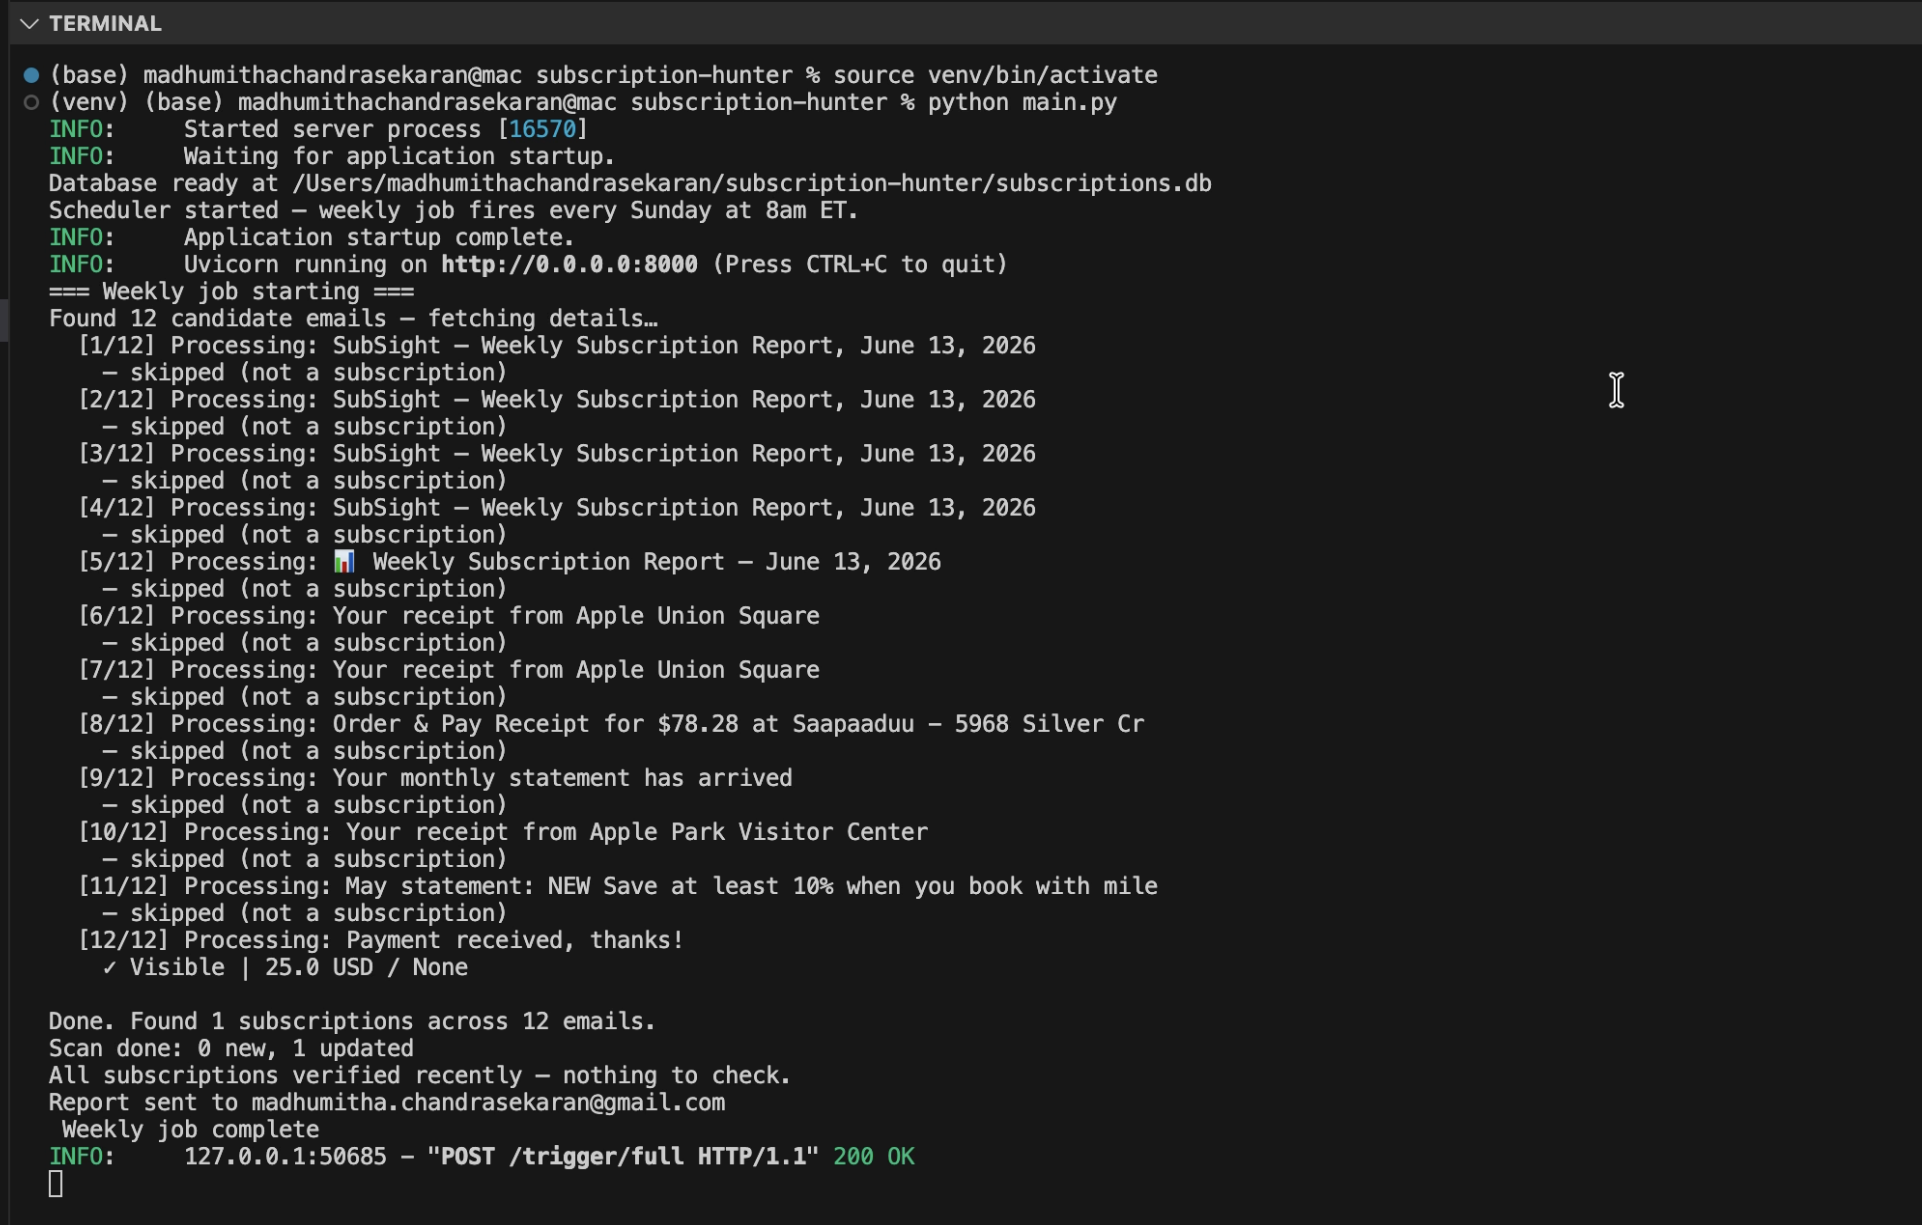
Visuals
SubSight weekly job terminal output SubSight weekly subscription report email

06 Academic Project

Multimodal Deception Detection

Binary supervised classification of truthful vs. deceptive courtroom testimony using facial, acoustic, and behavioral signals fused across three modalities.

Role
Team member · audio pipeline, feature engineering & model evaluation · 2025
Stack
Python · librosa · parselmouth (Praat) · scikit-learn · OpenFace · DeepFace · TensorFlow · FFmpeg · pandas
Overview

Deception detection is a problem of significant practical importance across law enforcement, border security, legal proceedings, and human resources. Human accuracy at identifying deceptive behavior averages only 54%, barely above chance. This project is motivated by the hypothesis that fusing facial, acoustic, and behavioral signals can outperform any individual modality and represent a step toward a practically deployable deception detection framework. The task is binary supervised classification: given a short video clip of courtroom testimony, predict whether the statement is deceptive or truthful.

Dataset
  • Real-life Trial dataset: 121 short video clips (61 deceptive, 60 truthful) of courtroom testimony, nearly class-balanced, labeled from verified case outcomes.
  • Dolos dataset: 1,446 video clips with behavioral annotations used for cross-dataset generalization. Combined with Real-life Trial on 27 shared features, totaling 1,567 samples.
  • Central challenge: the small size of 121 clips necessitates rigorous stratified k-fold cross-validation and careful regularization throughout.
Three Modalities
  • Behavioral: 39 binary features encoding facial expressions, head pose, gaze direction, and hand movement patterns annotated frame-by-frame.
  • Audio: 134 handcrafted features including 20 MFCCs, spectral centroid, rolloff, bandwidth, contrast, ZCR, RMS energy, pitch statistics, pause ratio, jitter, shimmer, and HNR via librosa and Praat/parselmouth.
  • Facial: 713 continuous-valued features from OpenFace (Action Units, head pose, 68 facial landmarks) and DeepFace (face embeddings).
My Contribution: Audio Pipeline

Extracted audio from MP4 clips as 16kHz mono WAV via FFmpeg. Computed 134 handcrafted features across prosodic, spectral, energy, and voice quality families. Applied variance thresholding and Pearson correlation filtering to reduce from 134 to 79 features. Trained an SVM with RBF kernel using repeated stratified 5-fold CV with hyperparameters tuned on inner folds. The audio pipeline achieved 72.7% accuracy and 0.819 AUC.

Visual Pipeline

A 3-layer MLP trained on 713 OpenFace and DeepFace features with Batch Normalization, Dropout, and early stopping. Achieved 91.7% accuracy and 0.9735 AUC, the strongest unimodal result. Behavioral SVM achieved 81.8% accuracy on the primary dataset.

Late Fusion Results
  • Simple averaging: 90.1% accuracy, 0.900 F1.
  • Weighted averaging: 90.1% accuracy, 0.902 F1.
  • Majority voting: 81.0% accuracy, 0.835 F1.
  • Fusion did not surpass the visual NN baseline (91.7%) because the Visual NN produces near-perfect class separation while the Audio SVM predictions heavily overlap around 0.4–0.6, fusing a high-confidence signal with an uncertain one degrades the decision boundary.
Ethics & Limitations
  • Representation bias: 121 clips from a narrow population, performance will degrade for underrepresented demographics.
  • Scientific validity: the premise that lying produces consistent detectable signals is heavily contested; no universally accepted physiological marker of deception exists.
  • Speaker confound, small dataset size, no temporal modeling, and audio-only limitations for the audio pipeline.
  • Intended as a decision-support signal requiring mandatory human review, not a standalone automated system.
Future Scope
  • Scale dataset to diverse demographics, languages, and recording conditions.
  • Add transcript-based NLP as a third modality for true trimodal fusion.
  • Apply LSTM or Transformer-based models over frame-level sequences to capture temporal deception dynamics.
Visuals

07 Personal Project

Revenue Intelligence Platform: Finance Analytics

An end-to-end finance analytics system that forecasts ARR, quantifies churn-driven revenue risk, and enables scenario planning, built on a medallion data architecture in Databricks with an interactive Tableau dashboard.

Role
Solo · end-to-end design, build & analysis · 2025
Stack
Databricks · PySpark · Delta Lake · XGBoost · Prophet · Tableau · Python · pandas · numpy
Domain
Finance Analytics · SaaS
Dataset
10,000 customers · 36 months
Overview

At most SaaS companies below $100M ARR, the monthly revenue review is a manual process. An analyst spends two to three days pulling data from Salesforce, Stripe and spreadsheets, calculating churn, building an ARR waterfall in Excel, and presenting to leadership. When a CFO asks "what happens if retention worsens by 10%?", the analyst rebuilds the model overnight. This project automates that workflow, answering five questions automatically: current ARR, ARR at risk, 12-month forecast, segment-level risk breakdown, and Bear / Base / Bull scenario projections.

What it Does
  • Generates 10,000 synthetic customers across 36 months using statistical simulation, with churn calibrated to ChartMogul SaaS benchmarks (Enterprise 5%, Mid-Market 12%, SMB 22% annually).
  • Lands raw data in Bronze Delta tables, cleans and types it in Silver, and engineers business-ready features in Gold using PySpark and Spark SQL window functions (rolling logins, ticket trends, MRR growth via LAG, tenure, churn label).
  • Trains an XGBoost churn classifier on months 1 to 33 with class imbalance handling, holding out the final 3 months. Achieves AUC of 0.986 with rolling logins, ticket trend, tenure and MRR as top features.
  • Quantifies revenue at risk as churn probability times ARR per customer, then aggregates by segment and plan to translate model output into a finance metric.
  • Fits Prophet on 36 months of ARR to project 12 months forward with 95% confidence intervals and changepoint detection for growth-rate shifts.
  • Runs Bear, Base and Bull scenarios by adjusting churn probabilities by plus or minus 10% and recalculating ARR and risk under each assumption.
  • Surfaces everything in an interactive Tableau dashboard with cross-sheet filter actions and a scenario explorer for stakeholders.
Key Outcomes
  • $33.2M total ARR modelled across 7,657 active customers, with $2.02M of ARR at risk surfaced by the churn model.
  • XGBoost test AUC of 0.986 on the held-out 3-month window, with model outputs translated into segment-level dollar exposure.
  • Prophet forecast projects ARR growing from $33.2M to $43.2M by Dec 2025, a 30% increase over 12 months.
  • Bear, Base and Bull scenarios at $41.0M, $43.2M and $45.3M respectively quantify a $4.3M spread, the financial value of a structured customer success program.
  • Enterprise holds 55% of ARR with 12.5% of customers, while SMB drives 81% of total ARR at risk despite only 36.6% of revenue, identifying SMB retention as the highest-leverage intervention.
  • A 10% churn improvement recovers $2.1M in projected ARR by Dec 2025 versus the Base case, giving a measurable ROI for customer success investment.
Revenue Intelligence Platform Tableau dashboard